Lasso fit
September 26, 2014 Leave a comment
The code I was given
set.seed(3523)
library(AppliedPredictiveModeling)
data(concrete)
inTrain = createDataPartition(concrete$CompressiveStrength, p = 3/4)[[1]]
training = concrete[ inTrain,]
testing = concrete[-inTrain,]
This is the data
<- head(as.matrix(training))
    Cement BlastFurnaceSlag FlyAsh Water Superplasticizer CoarseAggregate
47   349.0              0.0      0 192.0              0.0          1047.0
55   139.6            209.4      0 192.0              0.0          1047.0
56   198.6            132.4      0 192.0              0.0           978.4
58   198.6            132.4      0 192.0              0.0           978.4
63   310.0              0.0      0 192.0              0.0           971.0
115  362.6            189.0      0 164.9             11.6           944.7
    FineAggregate Age CompressiveStrength
47          806.9   3               15.05
55          806.9   7               14.59
56          825.5   7               14.64
58          825.5   3                9.13
63          850.6   3                9.87
115         755.8   7               22.90
Lasso fit and plot
predictors <- as.matrix(training)[,-9]
lasso.fit <- lars(predictors,training$CompressiveStrength,type="lasso",trace=TRUE)
headings <- names(training[-(9:10)])
plot(lasso.fit, breaks=FALSE)
legend("topleft", headings,pch=8, lty=1:length(headings),col=1:length(headings))
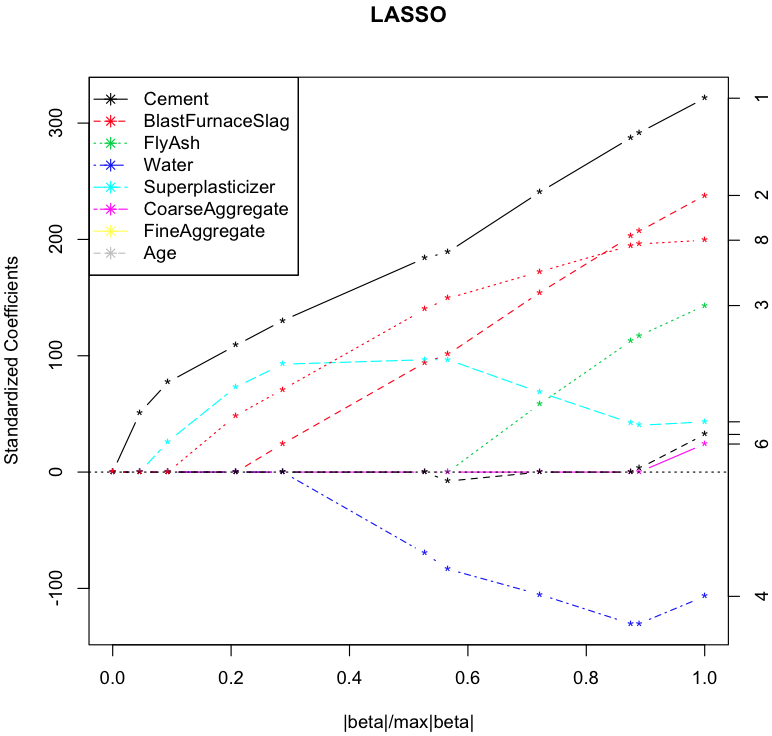
According to this graph the last coefficient to be set to zero as the penalty increases is Cement. I think this is correct but I may change this.
