RandomForests
September 22, 2014 Leave a comment
I am just posting R code at this time. The explanation is missing but I am making some progress.
library(ElemStatLearn)
library(randomForest)
data(vowel.train)
data(vowel.test)
> head(vowel.train)
y x.1 x.2 x.3 x.4 x.5 x.6 x.7 x.8 x.9 x.10
1 1 -3.639 0.418 -0.670 1.779 -0.168 1.627 -0.388 0.529 -0.874 -0.814
2 2 -3.327 0.496 -0.694 1.365 -0.265 1.933 -0.363 0.510 -0.621 -0.488
3 3 -2.120 0.894 -1.576 0.147 -0.707 1.559 -0.579 0.676 -0.809 -0.049
4 4 -2.287 1.809 -1.498 1.012 -1.053 1.060 -0.567 0.235 -0.091 -0.795
5 5 -2.598 1.938 -0.846 1.062 -1.633 0.764 0.394 -0.150 0.277 -0.396
6 6 -2.852 1.914 -0.755 0.825 -1.588 0.855 0.217 -0.246 0.238 -0.365
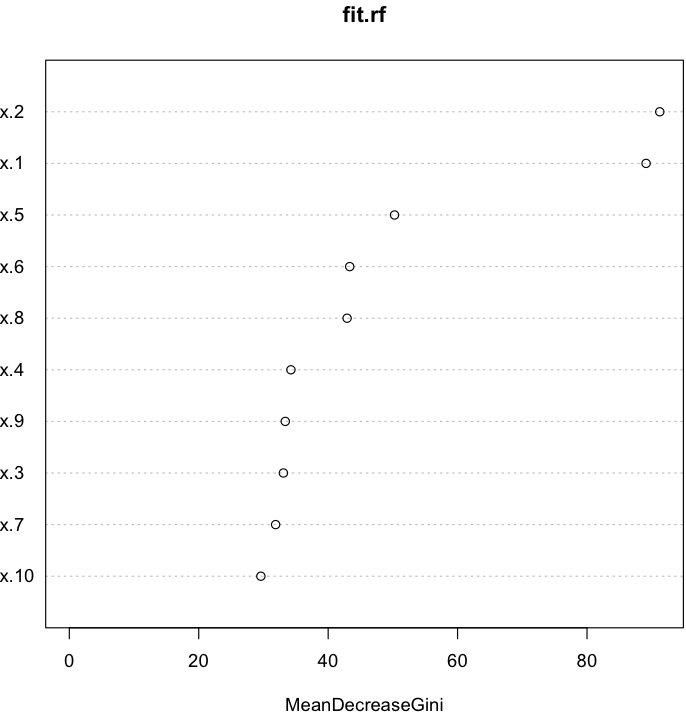
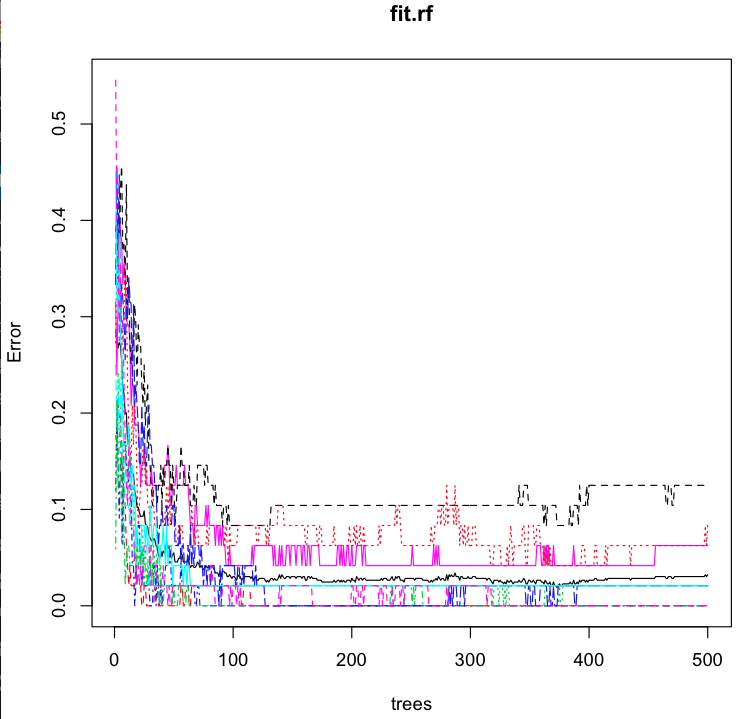
vowel.train$y <- factor(vowel.train$y)
set.seed(33833)
fit.rf <- randomForest(vowel.train$y ~ .,data=vowel.train)
plot(fit.rf)
varImpPlot(fit.rf)
I was asked to find the order of variable importance which this graph shows.