‘R’ code to parse the G1 gc log

I found this blog uses ‘R’ to parse the G1 gc logs. I am specifically using ‘Format 2’ log lines mentioned in the blog. This is one of my favorite techniques to learn ‘R’. The author uses Unix shell scripts to parse the data but I think ‘R’ to an excellent language to parse data. I have done this in the past.

Eventhough my code here is verbose a ‘R’ expert can make short work of the data easily. My code uses regular expressions too many times.

library(stringr)

g1 <- read.table("D:\\Python Data Analytics\\single_g1gc_trace.txt",sep="\t")

timestamps <- g1[ with(g1,  grepl("[0-9]+-[0-9]+-", V1)) , ]
timestamp <- str_extract(timestamps,'[^:]*:[^:]*')
heapsizes <- g1[ with(g1,  grepl("[0-9]+M+",  V1)) , ]

g1data <- data.frame( timestamp )
g1data$heapsizes <- heapsizes

heapsize <- str_extract_all(g1data$heapsizes,'[0-9]+')

g1data$BeforeSize <- 0
g1data$AfterSize <- 0
g1data$TotalSize <- 0
g1data$timestamp <- 0

row = NROW(g1data)
i = 1

	for( size in heapsize ){
	  if( i <= row ){
      	g1data[i,3] <- size[1]
	  	g1data[i,4] <- size[2]
	  	g1data[i,5] <- size[3]
	  	i = i + 1
	   }
	}
	i = 1
	for( stamp in timestamp ){
		if( i <= row ){
			g1data[i,1] <- stamp
			i = i + 1
		}
	}
	
g1data <- subset(g1data, select=c(timestamp,BeforeSize,AfterSize,TotalSize))

timestamp BeforeSize AfterSize TotalSize
1 2014-05-13T08:54 1938 904 9216
2 2014-05-13T08:54 1939 905 9217

Parsing HTML using BeautifulSoup

This Python code that parses HTML seems to truncate the tags when I print it. I am attempting to check for the presence of the ID attribute in the tags. The code just iterates over all tags and it does not specifically look for a HTML control. It just matches the opening and closing tag arbitratrily. I am still working on it and will update it.

D:\Python Data Analytics\view.html
   No                                                Tag
0   1  <div class="panel-collapse collapse" id="activ...
1   1  <select class="selectpicker " id="condition1...
2   1  <select class="selectpicker " id="condition2...
3   1  <select class="selectpicker " id="condition3...
4   1  <select class="selectpicker " id="condition4...
5   1  <select class="selectpicker " id="condition5...
6   1  <input class="btn xbtn-primary save" id="ApS...
7   1  <input class="btn btn-link" id="Cancel" name...
from bs4 import BeautifulSoup as bs
import sys
import os
import pandas as pd
import fnmatch

class Parse:
 
    def __init__(self):
        self.parse()


    def parse(self):
        
        pd.options.display.max_colwidth = 0
        try:
            path = "D:\\Python Data Analytics\\"
            
            f = open('D:\python\\report.html','w')

 
             #Pattern to be matched
            includes = ['*.html']
        
            for root, subFolders, files in os.walk(path):
                 for extensions in includes:
                     
                    for infile in fnmatch.filter(files, extensions):
                            soup = bs(open( path + infile, "r").read())
                                        
                            data = soup.findAll(True,{'id':True})
                            
                            df = pd.DataFrame(columns=[
                                                       'ID',
                                                       'Tag'])

                            idattributes = []
                            duplicates = [] 
                            
                            for attribute in data:
                                idTag = attribute.find('id')
                                att = attribute.attrs
                                idattributes.append(att['id'])
                                df = df.append(pd.DataFrame( [dict(
                                                                   ID=att['id'],
                                                                   Tag=attribute)] ),
                                                                   ignore_index=True)
                            s = set()
                            duplicates = set(x for x in idattributes if x in s or s.add(x))  
                                                              
                            data1 = soup.findAll(attrs={'id': None})
                            df1 = pd.DataFrame(columns=[
                                                       
                                                       'Tag'])
            
                            missingid = {} 
                            count = 0
                            for attribute in data1:
                                    missingid.update({count: attribute})
                                    df1 = df1.append(pd.DataFrame( [dict(
                                                                   Tag=attribute)] ),
                                                                   ignore_index=True)
                                    count = count + 1
                                    
                            df2 = pd.DataFrame(missingid.items())
                            html5report = df
                            print df2
                            html5report1 = df2
                            
                            table = ""
                            table += '<table>'
                            for element in duplicates:
                                table += '  <tr>'
                                table += '    <td>' + element + '</td>'
                                table += '  </tr>'
                            table += '</table>'
                            
                            html5report1 = html5report1.to_html().replace('<table border="1" class="dataframe">','<table class="table table-striped">')
                            html5report = html5report.to_html().replace('<table border="1" class="dataframe">','<table class="table table-striped">')
                            htmlreporter = '''
            							<html>
                							<head>
                    						<link rel="stylesheet" href="https://maxcdn.bootstrapcdn.com/bootstrap/3.3.1/css/bootstrap.min.css">
                    						<style>body{ margin:0 100; background:whitesmoke; }</style>
                							</head>
                                            <body>
                                            <h1>HTML 5 Report</h1>
                                            <h2>''' + infile + '''</h2>
            
                                            <h3>Tags with ID present</h3>
                   								''' + html5report + '''
                                            <h3>Tags with ID not present</h3>
                                                ''' + html5report1 + '''
                                            <h3>Possible Duplicates</h3>
                                                ''' + table + '''
                							</body>
            				</html>'''
                            f.write(htmlreporter)
            f.close()    
                            
        except IOError as e:
            print "I/O error({0}): {1}".format(e.errno, e.strerror)
        except Exception, err:
            print "Unexpected error:", sys.exc_info()[0]
 

if __name__ == '__main__':
    instance = Parse()

Pandas and matplotlib

matplotlibI have used R Data Frames and they were very versatile and compared to that the pandas Data Frames seem slightly harder to get right. But I am after the excellent support for Machine Learning and data analytics that scikit provides.

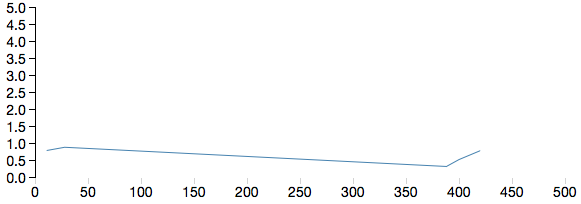
This graph is simple and I usually parse Java GC logs to practise. I plan to parse the Java G1 GC log to get my hands dirty by using pandas Data Frames.

  AfterSize BeforeSize RealTime       SecondsSinceLaunch TotalSize
0        20      3.109     9216  2014-05-13T13:24:35.091      5029
1      9125      3.459     9216  2014-05-13T13:24:35.440      6077
2        25      5.599     9216  2014-05-13T13:24:37.581      8470
3        44     10.704     9216  2014-05-13T13:24:42.686        15
4        51     16.958     9216  2014-05-13T13:24:48.941        20
5        92     24.066     9216  2014-05-13T13:24:56.049        26
6       602     62.383     9216  2014-05-13T13:25:34.368        68
import pandas as pd
import matplotlib.pyplot as plt
import matplotlib.dates as mdates

def main():
    gclog = pd.DataFrame(columns=['SecondsSinceLaunch',
                                   'BeforeSize',
                                   'AfterSize',
                                   'TotalSize',
                                   'RealTime'])
    with open("D:\\performance\\data.txt", "r") as f:
        for line in f:
            strippeddata = line.split()
            gclog = gclog.append(pd.DataFrame( [dict(SecondsSinceLaunch=strippeddata[0],
                                                     BeforeSize=strippeddata[1],
                                                     AfterSize=strippeddata[2],
                                                     TotalSize=strippeddata[3],
                                                     RealTime=strippeddata[4])] ),
                                               ignore_index=True)
    print gclog
    #gclog.time = pd.to_datetime(gclog['SecondsSinceLaunch'], format='%Y-%m-%dT%H:%M:%S.%f')
    gclog = gclog.convert_objects(convert_numeric=True)
    plt.plot(gclog.TotalSize, gclog.AfterSize)
    plt.show()
if __name__=="__main__":
    main()

matplotlib

Update :

The graph shown above is not clear and it looks wrong. I have improved it to some extent using this code. Matplotlib has many features more powerful than what I used earlier. I have commented the code used to annotate and display the actual points in the graph. I couldn’t properly draw the tick marks so that the red graph is clearly shown because the data range wasn’t easy to work with. There should be some feature that I still have not explored.


import pandas as pd
import matplotlib.pyplot as plt
import matplotlib.dates as mdates
import numpy as np

def main():
    gclog = pd.DataFrame(columns=['SecondsSinceLaunch',
                                   'BeforeSize',
                                   'AfterSize',
                                   'TotalSize',
                                   'RealTime'])
    with open("D:\\performance\\data.txt", "r") as f:
        for line in f:
            strippeddata = line.split()
            gclog = gclog.append(pd.DataFrame( [dict(SecondsSinceLaunch=strippeddata[0],
                                                     BeforeSize=strippeddata[1],
                                                     AfterSize=strippeddata[2],
                                                     TotalSize=strippeddata[3],
                                                     RealTime=strippeddata[4])] ),
                                               ignore_index=True)
    print gclog
    #gclog.time = pd.to_datetime(gclog['SecondsSinceLaunch'], format='%Y-%m-%dT%H:%M:%S.%f')
    gclog = gclog.convert_objects(convert_numeric=True)
    fig, ax = plt.subplots(figsize=(17, 14), facecolor='white', edgecolor='white')
    ax.axes.tick_params(labelcolor='darkblue', labelsize='10')
    for axis, ticks in [(ax.get_xaxis(), np.arange(10, 8470, 100) ), (ax.get_yaxis(), np.arange(10, 9125, 300))]:
        axis.set_ticks_position('none')
        axis.set_ticks(ticks)
        axis.label.set_color('#999999')
        if False: axis.set_ticklabels([])
    plt.grid(color='#999999', linewidth=1.0, linestyle='-')
    plt.xticks(rotation=70)
    plt.gcf().subplots_adjust(bottom=0.15)
    map(lambda position: ax.spines[position].set_visible(False), ['bottom', 'top', 'left', 'right'])
    ax.set_xlabel(r'AfterSize'), ax.set_ylabel(r'TotalSize')
    ax.set_xlim(10, 8470, 100), ax.set_ylim(10, 9125, 300)    
    plt.plot(sorted(gclog.AfterSize),gclog.TotalSize,c="red")
#     for i,j in zip(sorted(gclog.AfterSize),gclog.TotalSize):
#         ax.annotate('(' + str(i) + ',' + str(j) + ')',xy=(i, j))
    
    plt.show()
if __name__=="__main__":
    main()

figure_1

sigmoid function

What is a sigmoid function ?

It is http://mathworld.wolfram.com/SigmoidFunction.html

This simple code is the standard way to plot it. I am using Octave.

x = -10:0.1:10;
a = 1.0 ./ (1.0 + exp(-x));
figure;
plot(x,a,'-','linewidth',3)

sigmoid

R wordcloud

A piece of R code to beat the rut of my day job.

I have a document in the directory.

 transcript<-Corpus(DirSource("~/Documents/Algorithms/rcloud/"))
 transcript<-tm_map(transcript,stripWhitespace)
 transcript<-tm_map(transcript,tolower)
 transcript<-tm_map(transcript,stemDocument)
 transcript<-tm_map(transcript,PlainTextDocument)
 wordcloud(transcript,scale=c(5,0,5),max.words=100,random.order=FALSE,rot.per=0.35,use.r.layout=FALSE,colors=brewer.pal(8,"Dark2"))

wordcloud

DOM manipulation in an AngularJS directive

I serve my AngularJS files from my NodeJS web server. So the external template in this directive is also served from there.

If we need to serve simple content from another web server and manipulate the DOM in a directive to render it appropriately, we can use a directive like this. I am able to manipulate the DOM and also change the innerText of td tags.


directive("testdirective", function(){
 return {
   restrict: "E",
   transclude: true,
   scope: {
     title: "@"
   },
   templateUrl: "/test.html",
   
   link: function(scope, element, attrs){
        
        console.log( document.querySelector('#documents_forms')) ;
        
        var table = angular.element( document.querySelector( '#documents_forms' ) );
        
        var tbodies = element.find('tbody');
        
        var columntext = [];
        
        for( var i = 0; i < tbodies.length; i ++ ){

          var tr = tbodies[i];

          var tds = $(tr).find('td');

          var text = [];

          var documentname;

          for( var y = 0; y &amp;amp;amp;lt; tds.length; y ++ ){

            tds[y].innerText = 'Test';

            documentname = tds[y].innerText;

            text.push( documentname );
          }
          columntext.push( text )
        }
        console.log( columntext );
   }
 };
})

node-gyp rebuild

This does not stop karma from working on my Win 7 32-bit machine. So I was wondering what it means here because on my Mac ‘node-gyp’ actually built after I updated my XCode for Mavericks. I mean that on the Mac I saw the same error initially but after my XCode update ‘node-gyp’ was built and this error vanished.

FSEvents is an API only available on OS X:

http://en.wikipedia.org/wiki/FSEvents

Therefore it is understandable that the fsevents npm module which provides a node interface to that OS API cannot be built on systems other than OS X.In the case of karma it appears to have been handled by making fsevents an optional dependency.

Mac OSX Mavericks

> fsevents@0.3.5 install /usr/local/lib/node_modules/karma/node_modules/chokidar/node_modules/fsevents
> node-gyp rebuild

SOLINK_MODULE(target) Release/.node
SOLINK_MODULE(target) Release/.node: Finished
CXX(target) Release/obj.target/fse/fsevents.o
SOLINK_MODULE(target) Release/fse.node
SOLINK_MODULE(target) Release/fse.node: Finished

> ws@0.4.32 install /usr/local/lib/node_modules/karma/node_modules/socket.io/node_modules/socket.io-client/node_modules/ws
> (node-gyp rebuild 2> builderror.log) || (exit 0)

CXX(target) Release/obj.target/bufferutil/src/bufferutil.o
SOLINK_MODULE(target) Release/bufferutil.node
SOLINK_MODULE(target) Release/bufferutil.node: Finished
CXX(target) Release/obj.target/validation/src/validation.o
SOLINK_MODULE(target) Release/validation.node
SOLINK_MODULE(target) Release/validation.node: Finished

Windows 7 32-bit

This seemed to be a problem until I installed Visual Studio Express 2005.

d:\jwt\sails-angular-jwt-example-master\sails-angular-jwt-example-master\node_mo
dules\bcrypt>node “d:\nodejs\node_modules\npm\bin\node-gyp-bin\\..\..\node_modul
es\node-gyp\bin\node-gyp.js” rebuild
blowfish.cc
bcrypt.cc
bcrypt_node.cc
C:\Program Files\Microsoft Visual Studio 10.0\VC\include\xlocale(323): warning
C4530: C++ exception handler used, but unwind semantics are not enabled. Specif
y /EHsc [d:\jwt\sails-angular-jwt-example-master\sails-angular-jwt-example-mast
er\node_modules\bcrypt\build\bcrypt_lib.vcxproj]
C:\Users\476458\.node-gyp.10.35\deps\v8\include\v8.h(184): warning C4506: no
definition for inline function ‘v8::Persistent v8::Persistent::New(v8::Ha
ndle)’ [d:\jwt\sails-angular-jwt-example-master\sails-angular-jwt-example-ma
ster\node_modules\bcrypt\build\bcrypt_lib.vcxproj]
with
[
T=v8::Object
]
Creating library d:\jwt\sails-angular-jwt-example-master\sails-angular-jwt
-example-master\node_modules\bcrypt\build\Release\bcrypt_lib.lib and object d
:\jwt\sails-angular-jwt-example-master\sails-angular-jwt-example-master\node_
modules\bcrypt\build\Release\bcrypt_lib.exp
Generating code
Finished generating code
bcrypt_lib.vcxproj -> d:\jwt\sails-angular-jwt-example-master\sails-angular-j
wt-example-master\node_modules\bcrypt\build\Release\\bcrypt_lib.node
bcrypt@0.7.8 node_modules\bcrypt
└── bindings@1.0.0

JavaScript internals

js I haven’t blogged in a long time and there is no code in this post. But You-Dont-Know-JS holds promise. That is all for now.

Data visualization using D3.js and Flask

flask

I set about visualizing my twitter stream data using Apache Storm. The code uses Storm to stream tweets to Redis. Python Flask accesses the keys and values from Redis and streams to the browser. D3.js renders the view. In this post I am showing sample code that uses D3.js and Python Flask. JSON data is passed from the Flask web server to the D3.js library. The code doesn’t stream tweets now but as we know tweets are received in JSON too.

This code also uses other libraries like numpy and pandas. It is also possible to use Machine Learning algorithms from scikit.

I will endeavor to post Python code that uses Redis and Apache Storm code that uses Twitter4J and OAuth later. The idea is to visualize streaming tweets from the Twitter garden hose in real-time in the browser. The star of this show is actually Apache Storm and Redis. More about that later.

All of this is made possible by the Vagrant box with Ubuntu. But I had to execute sudo apt-get update, upgrade gcc, execute sudo apt-get install python2.7-dev and then execute sudo pip install pandas

HTML


<html>
<head>
  <meta charset="UTF-8">
  <title>Page Title</title>
  <!-- Latest compiled and minified CSS -->
  <link rel="stylesheet" href="//netdna.bootstrapcdn.com/bootstrap/3.1.1/css/bootstrap.min.css">
  <!-- Optional theme -->
  <link rel="stylesheet" href="//netdna.bootstrapcdn.com/bootstrap/3.1.1/css/bootstrap-theme.min.css">
  <!-- APP js -->
  <script src="//ajax.googleapis.com/ajax/libs/jquery/1.11.1/jquery.min.js"></script>
  <!-- add d3 from web -->
  <script src="http://d3js.org/d3.v3.min.js" charset="utf-8"></script>
  <style>
  path {
    stroke: steelblue;
    stroke-width: 1;
    fill: none;
  }
  .axis {
    shape-rendering: crispEdges;
  }

  .x.axis line {
    stroke: lightgrey;
  }

  .x.axis .minor {
    stroke-opacity: .5;
  }

  .x.axis path {
    display: none;
  }

  .y.axis line, .y.axis path {
    fill: none;
    stroke: #000;
  }

  </style>
</head>
<body>
  <div id="graph" class="aGraph" style="position:absolute;top:20pxleft:400; float:left"></div>
</body>
<script>

                    var margin = {top: 30, right: 20, bottom: 70, left: 50},
                    width = 600 - margin.left - margin.right,
                    height = 270 - margin.top - margin.bottom;


                    //Create the Scale we will use for the Axis
                    var axisScale = d3.scale.linear()
                                             .domain([0, 500])
                                             .range([0, width]);


                    var yaxisScale = d3.scale.linear()
                    .domain([0, 5])
                    .range([ height,0]);

                    var xAxis = d3.svg.axis()
                    .scale(axisScale)
                    .orient("bottom");

                    var yAxis = d3.svg.axis()
                    .scale(yaxisScale)
                    .orient("left");

                    var svgContainer = d3.select("body").
                    append("svg")
                    .attr("width", width + margin.left + margin.right)
                    .attr("height", height + margin.top + margin.bottom)
                    .append("g")
                    .attr("transform", "translate(" + margin.left + "," + margin.top + ")");

                    svgContainer.append("g")
                    .attr("class", "x axis")
                    .attr("transform", "translate(0," + height + ")")
                    .call(xAxis);

                    svgContainer.append("g")
                    .attr("class", "y axis")
                    .call(yAxis);

                    // create a line
                    var line = d3.svg.line()
                    .x(function(d,i) {
                      console.log(d.x);
                      return axisScale(d.x);
                    })
                    .y(function(d,i) {
                      console.log(d.y);
                      return yaxisScale(d.y);
                    })
                    var data = {{ data|safe }}
                    svgContainer.append("svg:path").attr("class", "line").attr("d", line(data));

</script>

</html>


Python


from flask import Flask, render_template, Response,make_response

import redis
import random
import json
import pandas
import numpy as np

df = pandas.DataFrame({
    "x" : [11,28,388,400,420],
    "y" : np.random.rand(5)
})

d = [
    dict([
        (colname, row[i])
        for i,colname in enumerate(df.columns)
    ])
    for row in df.values
]
app = Flask(__name__)

@app.route('/streamdata')
def event_stream():
    make_response(d.to_json())

@app.route('/stream')
def show_basic():
    x = random.randint(0,101)
    y = random.randint(0,101)
    print json.dumps(d)
    return render_template("redisd3.html",data=json.dumps(d))


if __name__ == '__main__':
    app.run(threaded=True,
    host='0.0.0.0'
)

Line Graph

d3graph

Screen Shot 2014-12-07 at 9.54.00 PMI am looking for some cool code editors. One of it is Atom and it is slick. It is extensible.

I am not building my code using Atom. I am using Vagrant and building the code using maven after logging into the Virtual Box. But Atom’s rich feature set and Web core are very attractive.

Atom is really a worthwhile contribution to the coding community.

atom