Data visualization using D3.js and Flask
December 18, 2014 3 Comments

I set about visualizing my twitter stream data using Apache Storm. The code uses Storm to stream tweets to Redis. Python Flask accesses the keys and values from Redis and streams to the browser. D3.js renders the view. In this post I am showing sample code that uses D3.js and Python Flask. JSON data is passed from the Flask web server to the D3.js library. The code doesn’t stream tweets now but as we know tweets are received in JSON too.
This code also uses other libraries like numpy and pandas. It is also possible to use Machine Learning algorithms from scikit.
I will endeavor to post Python code that uses Redis and Apache Storm code that uses Twitter4J and OAuth later. The idea is to visualize streaming tweets from the Twitter garden hose in real-time in the browser. The star of this show is actually Apache Storm and Redis. More about that later.
All of this is made possible by the Vagrant box with Ubuntu. But I had to execute sudo apt-get update, upgrade gcc, execute sudo apt-get install python2.7-dev and then execute sudo pip install pandas
HTML
<html>
<head>
  <meta charset="UTF-8">
  <title>Page Title</title>
  <!-- Latest compiled and minified CSS -->
  <link rel="stylesheet" href="//netdna.bootstrapcdn.com/bootstrap/3.1.1/css/bootstrap.min.css">
  <!-- Optional theme -->
  <link rel="stylesheet" href="//netdna.bootstrapcdn.com/bootstrap/3.1.1/css/bootstrap-theme.min.css">
  <!-- APP js -->
  <script src="//ajax.googleapis.com/ajax/libs/jquery/1.11.1/jquery.min.js"></script>
  <!-- add d3 from web -->
  <script src="http://d3js.org/d3.v3.min.js" charset="utf-8"></script>
  <style>
  path {
    stroke: steelblue;
    stroke-width: 1;
    fill: none;
  }
  .axis {
    shape-rendering: crispEdges;
  }

  .x.axis line {
    stroke: lightgrey;
  }

  .x.axis .minor {
    stroke-opacity: .5;
  }

  .x.axis path {
    display: none;
  }

  .y.axis line, .y.axis path {
    fill: none;
    stroke: #000;
  }

  </style>
</head>
<body>
  <div id="graph" class="aGraph" style="position:absolute;top:20pxleft:400; float:left"></div>
</body>
<script>

                    var margin = {top: 30, right: 20, bottom: 70, left: 50},
                    width = 600 - margin.left - margin.right,
                    height = 270 - margin.top - margin.bottom;


                    //Create the Scale we will use for the Axis
                    var axisScale = d3.scale.linear()
                                             .domain([0, 500])
                                             .range([0, width]);


                    var yaxisScale = d3.scale.linear()
                    .domain([0, 5])
                    .range([ height,0]);

                    var xAxis = d3.svg.axis()
                    .scale(axisScale)
                    .orient("bottom");

                    var yAxis = d3.svg.axis()
                    .scale(yaxisScale)
                    .orient("left");

                    var svgContainer = d3.select("body").
                    append("svg")
                    .attr("width", width + margin.left + margin.right)
                    .attr("height", height + margin.top + margin.bottom)
                    .append("g")
                    .attr("transform", "translate(" + margin.left + "," + margin.top + ")");

                    svgContainer.append("g")
                    .attr("class", "x axis")
                    .attr("transform", "translate(0," + height + ")")
                    .call(xAxis);

                    svgContainer.append("g")
                    .attr("class", "y axis")
                    .call(yAxis);

                    // create a line
                    var line = d3.svg.line()
                    .x(function(d,i) {
                      console.log(d.x);
                      return axisScale(d.x);
                    })
                    .y(function(d,i) {
                      console.log(d.y);
                      return yaxisScale(d.y);
                    })
                    var data = {{ data|safe }}
                    svgContainer.append("svg:path").attr("class", "line").attr("d", line(data));

</script>

</html>
Python
from flask import Flask, render_template, Response,make_response

import redis
import random
import json
import pandas
import numpy as np

df = pandas.DataFrame({
    "x" : [11,28,388,400,420],
    "y" : np.random.rand(5)
})

d = [
    dict([
        (colname, row[i])
        for i,colname in enumerate(df.columns)
    ])
    for row in df.values
]
app = Flask(__name__)

@app.route('/streamdata')
def event_stream():
    make_response(d.to_json())

@app.route('/stream')
def show_basic():
    x = random.randint(0,101)
    y = random.randint(0,101)
    print json.dumps(d)
    return render_template("redisd3.html",data=json.dumps(d))


if __name__ == '__main__':
    app.run(threaded=True,
    host='0.0.0.0'
)
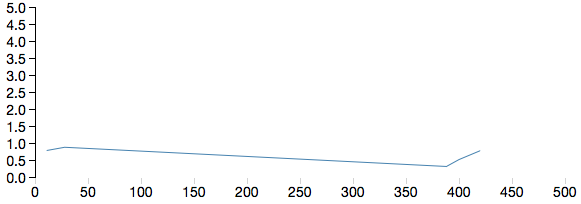
Line Graph

Could you pls post the directory structure. Im not able to run this in my flask. Thanks
I will try to. It has been a long time.
Put redisd3 file under templates directory