Aesthetics of ‘R’ Plots
August 31, 2015 1 Comment
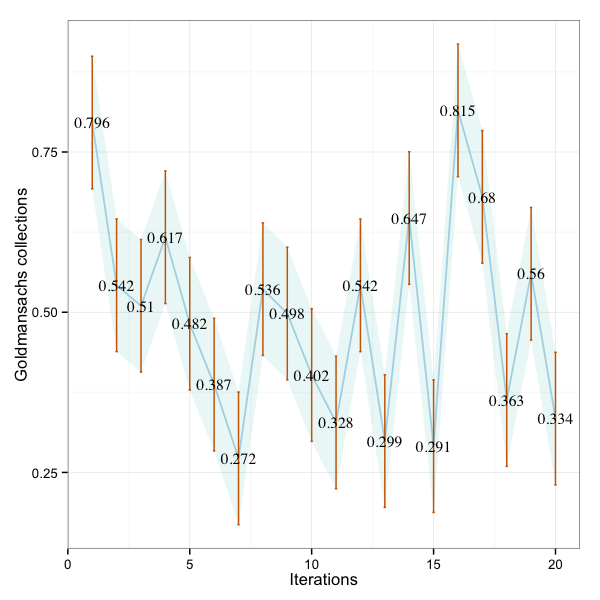
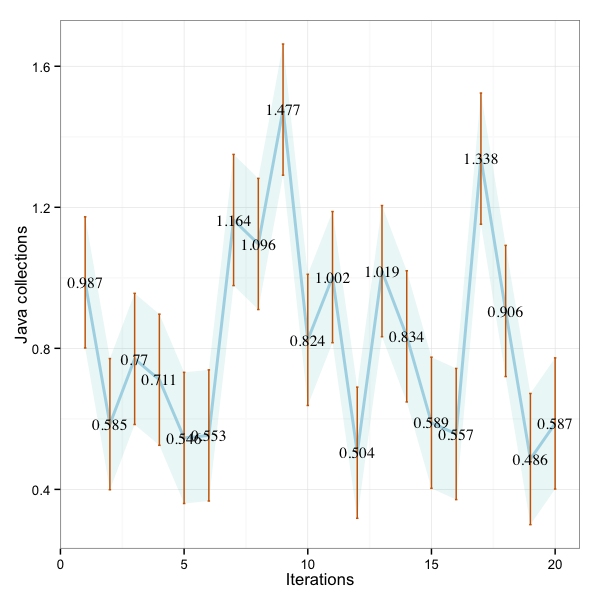
I submitted a fresh pull request to adoptopenjdk to rectify the graphs in parsing-java-micro-benchmarking-harness-data-using-dplyr-part-2 after the lead developer of gs-collections identified that the titles in the two graphs are switched.
It is very important that we do not mislead with data.
g <- ggplot(jc, aes(x = IDX, y = V1)) +
		theme_bw() +
		geom_ribbon(aes(ymin = V1 - error, ymax = V1 + error), fill = "lightseagreen",
				linetype = 2, alpha= 0.1) +
		geom_line(color = "lightblue", size = 0.6) +
		geom_errorbar(aes(ymin = V1 - error, ymax = V1 + error), width = 0.1,
				color = "darkorange3") +
		labs(x = "Iterations", y = "Goldmansachs collections") + geom_text(aes(label = V1), size=4, family="Times", lineheight=.8)

Pingback: Parsing Java Micro-benchmarking Harness data using dplyr – Part 2 | MindSpace