rCharts and nvd3
June 26, 2014 Leave a comment
I have been playing with some JavaScript chart libraries including nvd3 . These JS libraries are all wrapped by R code in the form of rCharts.
I have a data frame like this.
Var1 Freq
levelI 13
levelII 13
levelIII 12
levelIV 12
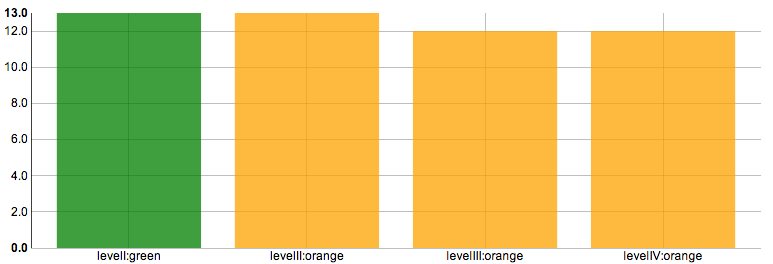
I want to plot a discreet bar chart using nvd3 and each bar should be of a different color depending on Var1. Var1 will have duplicate values.
#The type of <em>Var1</em> is integer in my data frame. So instead of debugging that
#I just convert it to "character" using this line.
bpf3$Var1 <- paste(bpf3$Var1,"",sep="")

#Match the first column with a hard-coded value and append a color
for(i in 1:nrow(bpf3)) {
    print(identical(bpf3[i,1],"levelI"))
    if(identical(bpf3[i,1],"levelI")){
      bpf3[i,1] <- paste(bpf3[i,1],"green",sep=":")
    }else{
      bpf3[i,1] <- paste(bpf3[i,1],"orange",sep=":")
    }
}
p2 = nPlot(x = "Var1", y = "Freq", data = bpf3, type = "discreteBarChart")

p2$chart(color = "#! function(d, x){ var color = d.Var1; return color.split(':')[1];} !#")
So it is possible to use a function that assigns a color to a bar in nvd3. rCharts lets you define a function like this.
The result is this. This is not an elegant way though.
Update :
The author of http://timelyportfolio.blogspot.in/ pointed out that there is a function that can be used like this.
  p2$chart(
    color = "#! function(d){
      var ourColorScale = d3.scale.ordinal().domain(['levelI','levelII']).range(['red','blue']);
      return ourColorScale(d.Event);
    }!#")
It works splendidly.
