‘R’ code to understand number of concurrent connections
September 25, 2013 Leave a comment
Proto Recv-Q Send-Q Local-Address               Foreign-Address             State
tcp        0      0 112.30.110.2:80             101.13.4.18:3037              SYN_RECV
tcp        0      0 112.30.110.2:80             101.13.4.18:3036              SYN_RECV
tcp        0      0 112.30.110.2:80             101.15.1.6:2431               SYN_RECV
tcp        0      0 112.30.110.2:80             101.16.32.19:1689             SYN_RECV
tcp        0      0 112.30.110.2:80             101.13.4.18:3035              SYN_RECV
tcp        0      0 ::ffff:172.210.100.12:80      ::ffff:101.11.5.7:3185        TIME_WAIT
tcp        0      0 ::ffff:172.210.100.12:80      ::ffff:101.15.1.3:3189        TIME_WAIT
tcp        0      0 ::ffff:172.210.100.12:80      ::ffff:101.15.5.7:3445        TIME_WAIT
tcp        0      0 ::ffff:172.210.100.12:80      ::ffff:101.13.29.13:2671       TIME_WAIT
I wanted to draw a graph showing the number of connections made by an IP(Foreign-Address) to our HTTP servers. This is a rough estimate of the concurrent connections. I know I have been smitten by ‘R’ but the power of this language is breathtaking.
I haven’t yet mastered the functional aspect of it but even so code like this one line to find the
frequency of values is really powerful. This line finds the count of the same IP’s(group) in the ‘Foreign-Address’ column in the data frame.
data <-as.data.frame(table(data$Foreign.Address))
The source code works perfectly but some of the parameters used to plot the graphs may not be needed. They don’t seem to interfere in any way but it is hard to understand all the parameters of the plotting API.
library(stringr)
this.dir <- dirname(parent.frame(2)$ofile)
setwd(this.dir)
par(mar=c(4,4,4,4))
data <- read.table("D:\\Log Analysis\\23-9-2013\\concurrentusage-node1",sep="",header=T,stringsAsFactors=FALSE, fill=TRUE)
var <- c("Foreign.Address")
data[,var] <- sapply(data[,var],function(x) ifelse(length(unlist(str_split(x,":")))==5,unlist(str_split(x,":"))[4],unlist(str_split(x,":"))[1]))
var <- c("Local.Address")
data[,var] <- sapply(data[,var],function(x) ifelse(length(unlist(str_split(x,":")))==5,paste(unlist(str_split(x,":"))[4],":",unlist(str_split(x,":"))[5]),
paste(unlist(str_split(x,":"))[1],":",unlist(str_split(x,":"))[2])))
#Begin stackoverflow.com answer
completeFun <- function(data, desiredCols) {
completeVec <- complete.cases(data[, desiredCols])
return(data[completeVec, ])
}
#End stackoverflow.com answer
data <- completeFun(data, c("Local.Address"))
data <- data[data$Proto == "tcp" ,]
data <-as.data.frame(table(data$Foreign.Address))
#data <- data[with(data, order(-Freq)), ]
data <-data.frame(data, stringsAsFactors = FALSE)
png(file="concurrencyhousers.png",width=700,height=250,res=72)
#User type 1
subsetdata <- subset(data, grepl("^172", Var1) & !grepl("^172.20.100.8", Var1) & !grepl("^172.20.100.9", Var1) )
plot(as.numeric(subsetdata$Var1),subsetdata$Freq,ylim=c(0,700),col="green",type="o",ylab="Number of connections",las=2,lwd=2.5,xaxt="n",xlab="IP")
axis(1,at=subsetdata$Var1,labels=subsetdata$Var1,las = 2,cex.axis=0.9,las=2)
title("Estimation of concurrent connections(HO Users-Sep,2013)",cex.main=1.3,line=1)
legend("topleft", lty=c(1,1),lwd=c(3.5,3.5),c(paste("Users",sep="--",length(subsetdata$Var1))))
#sink("parsedconcurrency.log")
#print(data)
#sink()
dev.off()
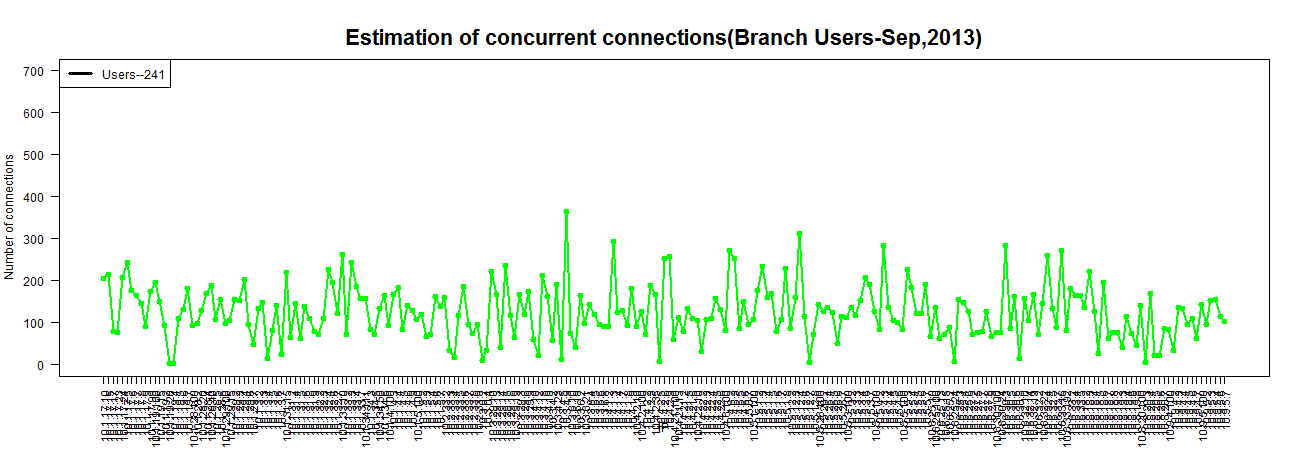
png(file="concurrencybranchusers.png",width=1300,height=450,res=72)
#User type 1
subsetdata <- subset(data, !grepl("^172", Var1) & !grepl("^127", Var1) )
plot(as.numeric(subsetdata$Var1),subsetdata$Freq,ylim=c(0,700),col="green",type="o",ylab="Number of connections",las=2,lwd=2.5,xaxt="n",xlab="IP")
axis(1,at=subsetdata$Var1,labels=subsetdata$Var1,las = 2,cex.axis=0.9,las=2)
title("Estimation of concurrent connections(Branch Users-Sep,2013)",cex.main=1.8,line=1)
legend("topleft", lty=c(1,1),lwd=c(3.5,3.5),c(paste("Users",sep="--",length(subsetdata$Var1))))
#sink("parsedconcurrency.log")
#print(data)
#sink()
dev.off()