R Shiny
June 8, 2014 Leave a comment
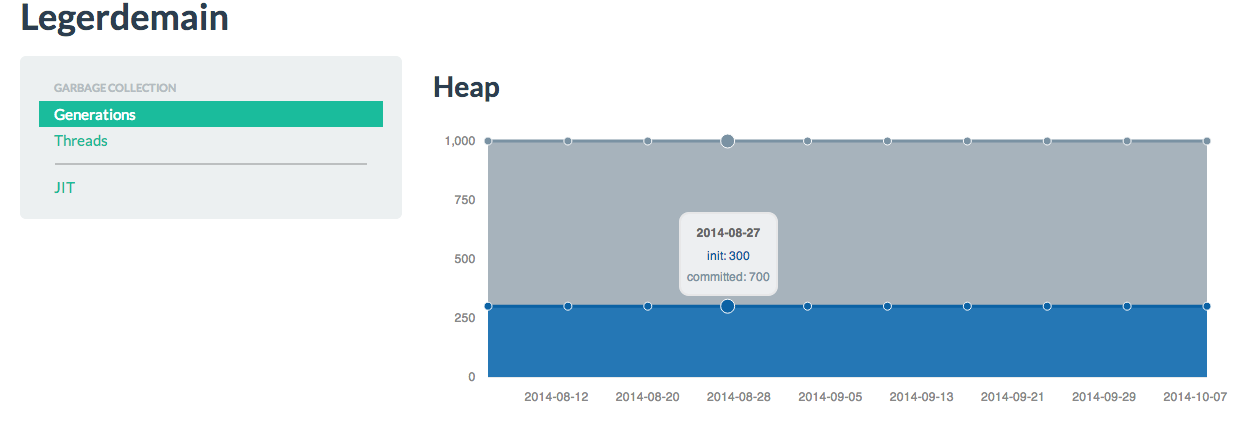
I have recently started to code a web dashboard to show information like heap usage in HotSpot. So initially I setup a Shiny server. The part that connects to HotSpot is not ready but this is my first Shiny UI. This is a Twitter BootStrap UI.
Part of the shiny server code is this. Now the data is generated by R code and later the data will be extracted from the JVM using JMX and other serviceability API’s.
output$metaspace <- renderChart({
  metacapacity <- data.frame(lapply(as.Date('2014-08-06') + 0:0, seq, as.Date('2014/10/08'), '1 weeks'));
  metacapacity['init'] <- 300
  metacapacity['committed'] <- 700
  colnames(metacapacity) <- c("date","init","committed")
  metacapacity  <- transform(metacapacity,date=as.character(date))
  ms <- mPlot(x = "date", y = c("init", "committed"), type = "Area", data = metacapacity)
  ms$addParams(height = 300, dom = 'metaspace')
  ms$set(title="MetaSpace")
  return(ms)
  })
