Error bars using ‘R’
December 9, 2013 Leave a comment
I believe our measurements are uncertain and we need to show the errors in our capacity measurement plots. I suspect that we are making fundamental mistakes in our attempts to gather performance statistics and drawing graphs. All the more reason for showing these uncertainties. Our management and clients should not be mislead by the lack of skills of our Capacity planners.
This code and the graph are used to learn one aspect of showing such errors. I am yet to investigate the type of errors and their statistical significance.
If there is a mistake I will make corrections to this blog entry.
Updated : Code and graph.
this.dir <- dirname(parent.frame(2)$ofile)
setwd(this.dir)
#Reference values plotted on x-axis. These are constant.
#These values could be time of day. So every day at the same
#time we could collect other measurements
referenceset <- data.frame(c(5,10,15,20,25,30,35,40,50,60))
colnames( referenceset) <- c("reference")
#These are the sets of measurements. So every day at the same
#time we could collect several samples. This is simulated now.
sampleset <- data.frame( matrix(sample(1:2, c(20000), replace = TRUE), ncol = 2000) )
sampleset <- cbind( sampleset, referenceset )
#Calculate mean
sampleset$mean <- apply(sampleset[,1:10],2,mean)
#Calculate Standard Deviation
sampleset$sd <- apply(sampleset[,c(1:10)],2,sd)
#Calculate Standard Error
sampleset$se <- sampleset$sd / sqrt(10)
#print(sampleset)
png(
"errorbars.png",
width =500, height = 510)
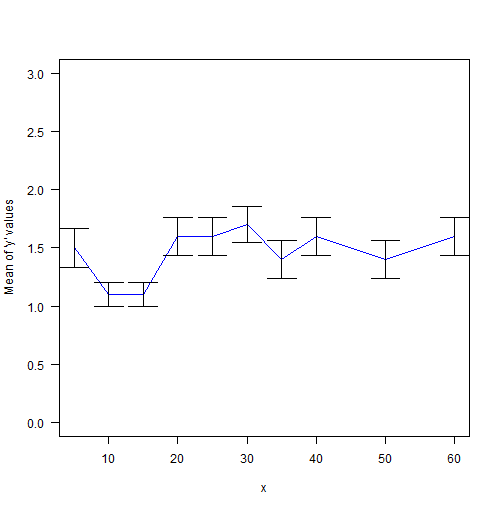
plot( sampleset$reference,
sampleset$mean,
las=1,
ylab="Mean of 'y' values",
xlab="x",
ylim=c(0,3),
type="l",
lwd=1,
col="blue"
);
arrows(sampleset$reference,
sampleset$mean-sampleset$se,
sampleset$reference,
sampleset$mean+sampleset$se,
code = 3,
angle=90,
length=0.2)
dev.off()