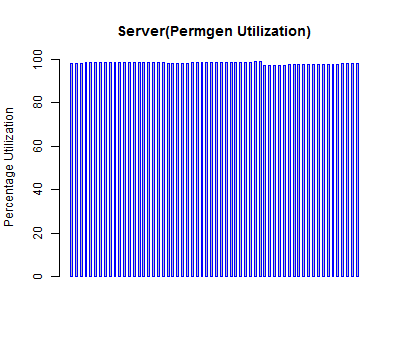
“R” graph showing permgen utilization
August 19, 2013 Leave a comment
Sample of Data gathered using jstat
P – Permanent space utilization as a percentage of the space’s current capacity
  S0     S1     E      O      P      YGC     YGCT    FGC    FGCT     GCT
 77.25   0.00  84.44  57.48  98.13   1136   39.241   129  244.316  283.558
R code
this.dir <- dirname(parent.frame(2)$ofile)
setwd(this.dir)
png(file="permgen.png",width=400,height=350,res=72)
data = read.table("D:\\Log analysis\\gcutil",header=T)
barplot(data$P,data$FGCT, space = 1.5, ylim = c(0, 100), ylab="Percentage Utilization", border="blue")
title(main="Server(Permgen Utilization)")
dev.off()
Graph
Permgen Utilization