Graph model
March 1, 2013 Leave a comment
Deliver an online site where patients can view and respond to a series of questions that help to determine their eligibility for a clinical trials*. A patient should be able to save their data and come back at a later date to update or complete the survey.
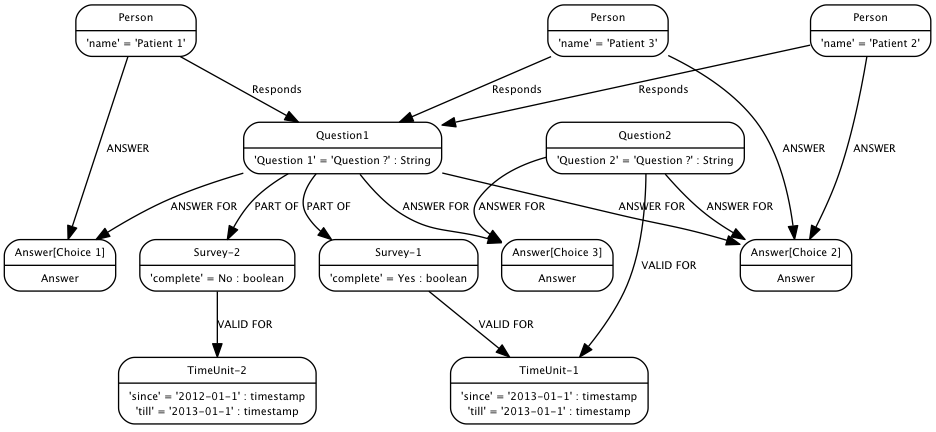
I was asked to draw a model for surveys recently. The surveys have questions and answers. A few years back I worked on a system that popped up questions in order to diagnose problems reported by customers. So based on the answers new questions will be posed on a site to enable diagnosis. So at that time we used a RDBMS and it did not seem to be a natural way of representing complex branches of questions and answers.
Now I realize a graph model represented in Neo4J graph DB can be a more flexible model. So a graph looks like a more realistic model of a survey.
- A proper model matching the problem
- Versioning and storage of historical records of entire surveys are possible
- Querying for historical records based on timestamped versions is possible. In this case ‘TimeUnit’ can be shown as a first-class graph node and not just data in a RDBMS.
- Reusability of answers and questions are clearly represented.
I am neither a RDBMS expert or a graph expert but the model shown below seems flexible enough.