Viewing Graphs
December 23, 2010 Leave a comment
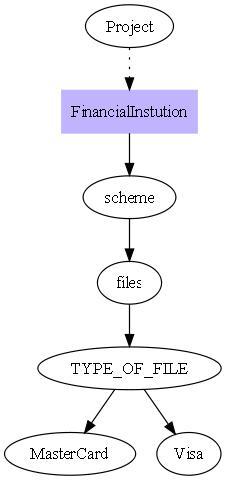
Some tools are simple and easy to use but very helpful. One such old tool is Graphviz which helped us quickly visualize the folder structures.
I could generate a pleasing graph from this simple data representation using Gvedit that is part of the download.
digraph Folders1 {

 size ="1,1";

 FinancialInstution [shape=box,style=filled,color=".7 .3 1.0"];

 Project -> FinancialInstution [style=dotted]

 FinancialInstution -> scheme -> files

 files -> TYPE_OF_FILE -> MasterCard

 TYPE_OF_FILE -> Visa

 }
This is the simple graph.